PostgreSQL: A deep dive of Prepared Statements
In a PostgreSQL database, preparing a statement involves parsing, analyzing and rewriting that specific statement. The result is compiled and stored in memory (which is usually called as statement caching). When a previous prepared statement is executed, PostgreSQL can skip the parsing, analyzing and rewriting steps and use the precompiled version instead. This can significantly improve database performance, especially for queries that are executed frequently or have complex plans. The more you execute a query, the bigger the probability for you to see significant improvements.
A common misunderstanding is to assume that the actual planning of the query doesn’t happen when you execute a prepared statement, which as per PostgreSQL docs is incorrect.
The following, lists what happens under the hood for each prepare or execute command issued to PostgreSQL:
- Prepare statement:
- Parse
- Analyze
- Rewrite
- Execute statement:
- Plan
- Execute
Here are some of the specific benefits of using prepared statements in PostgreSQL:
Reduced parsing: Prepared statements allow PostgreSQL to skip the parsing steps, which can be time-consuming for complex queries. By storing the parsed and planned version of a query in memory, PostgreSQL can save that time for all upcoming prepared statements/queries.
Reduced CPU usage: Prepared statements can reduce CPU usage because the parsing steps are performed only once, rather than every time a query is executed. This can be especially beneficial for more complex queries where parsing can take a few ms.
Improved scalability: Prepared statements can improve database scalability by reducing the amount of work required to execute a query.
Let’s test it
I’ve downloaded a docker container and loaded a User_ table in order to test the efficiency of prepared statements. The steps can be found in the following github project.
The query:
SELECT
  *
FROM
  user_ a
LEFT OUTER JOIN user_ b ON
  a.id = b.id
WHERE
  a.status = 5
ORDER BY
  a.createdat
The explain plan of the query:
Gather Merge  (cost=9918.43..12237.52 rows=20166 width=152) (actual time=421.329..515.106 rows=34068 loops=1)
   Workers Planned: 1
   Workers Launched: 1
   Buffers: shared hit=4795, temp read=418 written=418
   ->  Sort  (cost=8918.42..8968.83 rows=20166 width=152) (actual time=227.597..270.480 rows=17034 loops=2)
         Sort Key: a.createdat
         Sort Method: external merge  Disk: 3344kB
         Buffers: shared hit=4795, temp read=418 written=418
         Worker 0:  Sort Method: quicksort  Memory: 2994kB
         ->  Parallel Hash Right Join  (cost=3858.07..7476.59 rows=20166 width=152) (actual time=13.442..41.231 rows=17034 loops=2)
               Hash Cond: (b.id = a.id)
               Buffers: shared hit=4759
               ->  Parallel Seq Scan on user_ b  (cost=0.00..3356.00 rows=100000 width=76) (actual time=0.004..4.590 rows=85000 loops=2)
                     Buffers: shared hit=2356
               ->  Parallel Hash  (cost=3606.00..3606.00 rows=20166 width=76) (actual time=13.113..13.113 rows=17034 loops=2)
                     Buckets: 65536  Batches: 1  Memory Usage: 4416kB
                     Buffers: shared hit=2356
                     ->  Parallel Seq Scan on user_ a  (cost=0.00..3606.00 rows=20166 width=76) (actual time=0.014..21.118 rows=34068 loops=1)
                           Filter: (status = '5'::numeric)
                           Rows Removed by Filter: 135932
                           Buffers: shared hit=2356
 Planning:
   Buffers: shared hit=16
 Planning Time: 0.321 ms
 Execution Time: 528.540 ms
There is no real difference between the explain analyze of the query itself or the prepare statement of the same query. Although running it N times will supposedly generate a difference in execution times due to the saved time parsing, analyzing and rewriting. I’ve created a quick python script that runs the query N times and tracks the time spent using the query itself vs the prepared statement. Below follows the results:
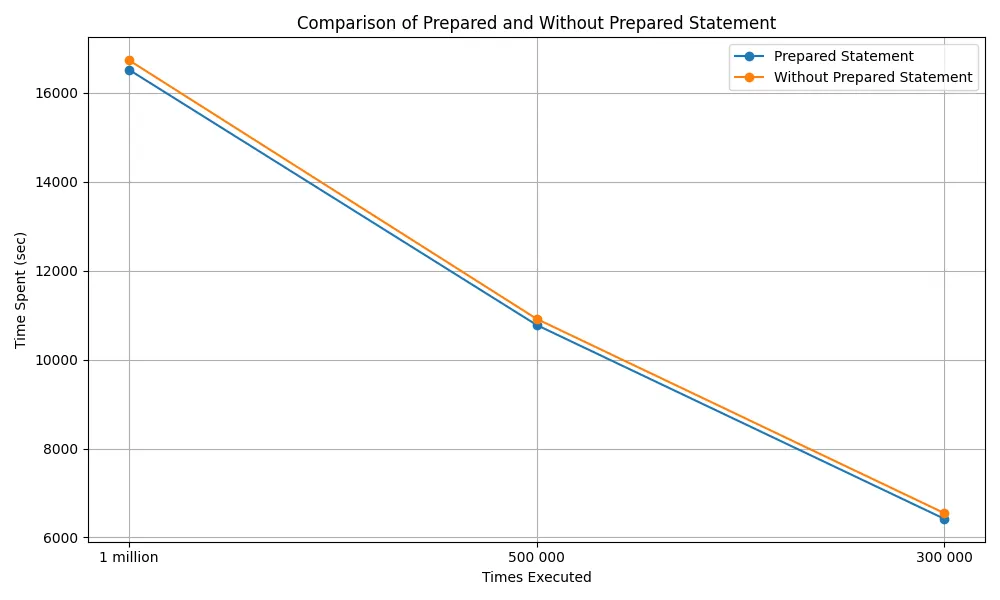
We see at least a 2% increase across different executions of the script with 1 million, 500K and 300K each time. These 2% look small but if we consider that saved CPU cycles and that it is most certainly any production environment will contain more complex queries there is only to benefit from preparing your queries.
You can further optimize this by looking into generic and custom plans, where the actual PLANNING of the query can also be stored in cache which PostgreSQL started to offer on version 12. Sharing a great article written by Franck Pachot on that analysis.